Create a site map using CasperJS and Graphviz
I recently challenged myself to start learning CasperJS, a scripting tool that is using the PhantomJS WebKit headless browser to navigate the web. For one of my first projects, I decided to build a site map generation script. Since I was already familiar with the Graphviz tools I decided to use the Graphviz sfdp command-line tool to generate visual site maps. This post is a short introduction to the tool, and how to use it.
CasperJS is an open-source navigation scripting & testing utility written in Javascript for the PhantomJS WebKit headless browser and SlimerJS (Gecko). It eases the process of defining a full navigation scenario and provides useful high-level functions, methods & syntactic sugar. - casperjs
The site mapper tool is available on Github.
The original CasperJS project has been archived, and it is no longer actively maintained. For new projects, consider using alternatives like Puppeteer
The site-mapper project has been updated to use Puppeteer instead of CasperJS. The new version is available in the old Github repository: markusos/site-mapper
How to use:
Install CasperJS, for more instructions see here: github.com/casperjs/casperjs
$ brew install casperjs --develRun the scrip to crawl your website, in this case this site “http://markusos.github.io/:
$ casperjs sitemap.js http://markusos.github.io/ > map.dotThis scrapes the provided site by following all publicly accessible internal links the crawler can find on the site. The script outputs the site structure in DOT format to the terminals standard output and can easily be piped to a file for further processing.
If you want to generate a visual site map graph from the DOT file output, you need to have Graphviz installed. Use Brew to install it, or if you don’t have a Mac with Brew get it from here: www.graphviz.org
$ brew install graphviz --with-gtsRun Graphviz on the site map DOT file with this command:
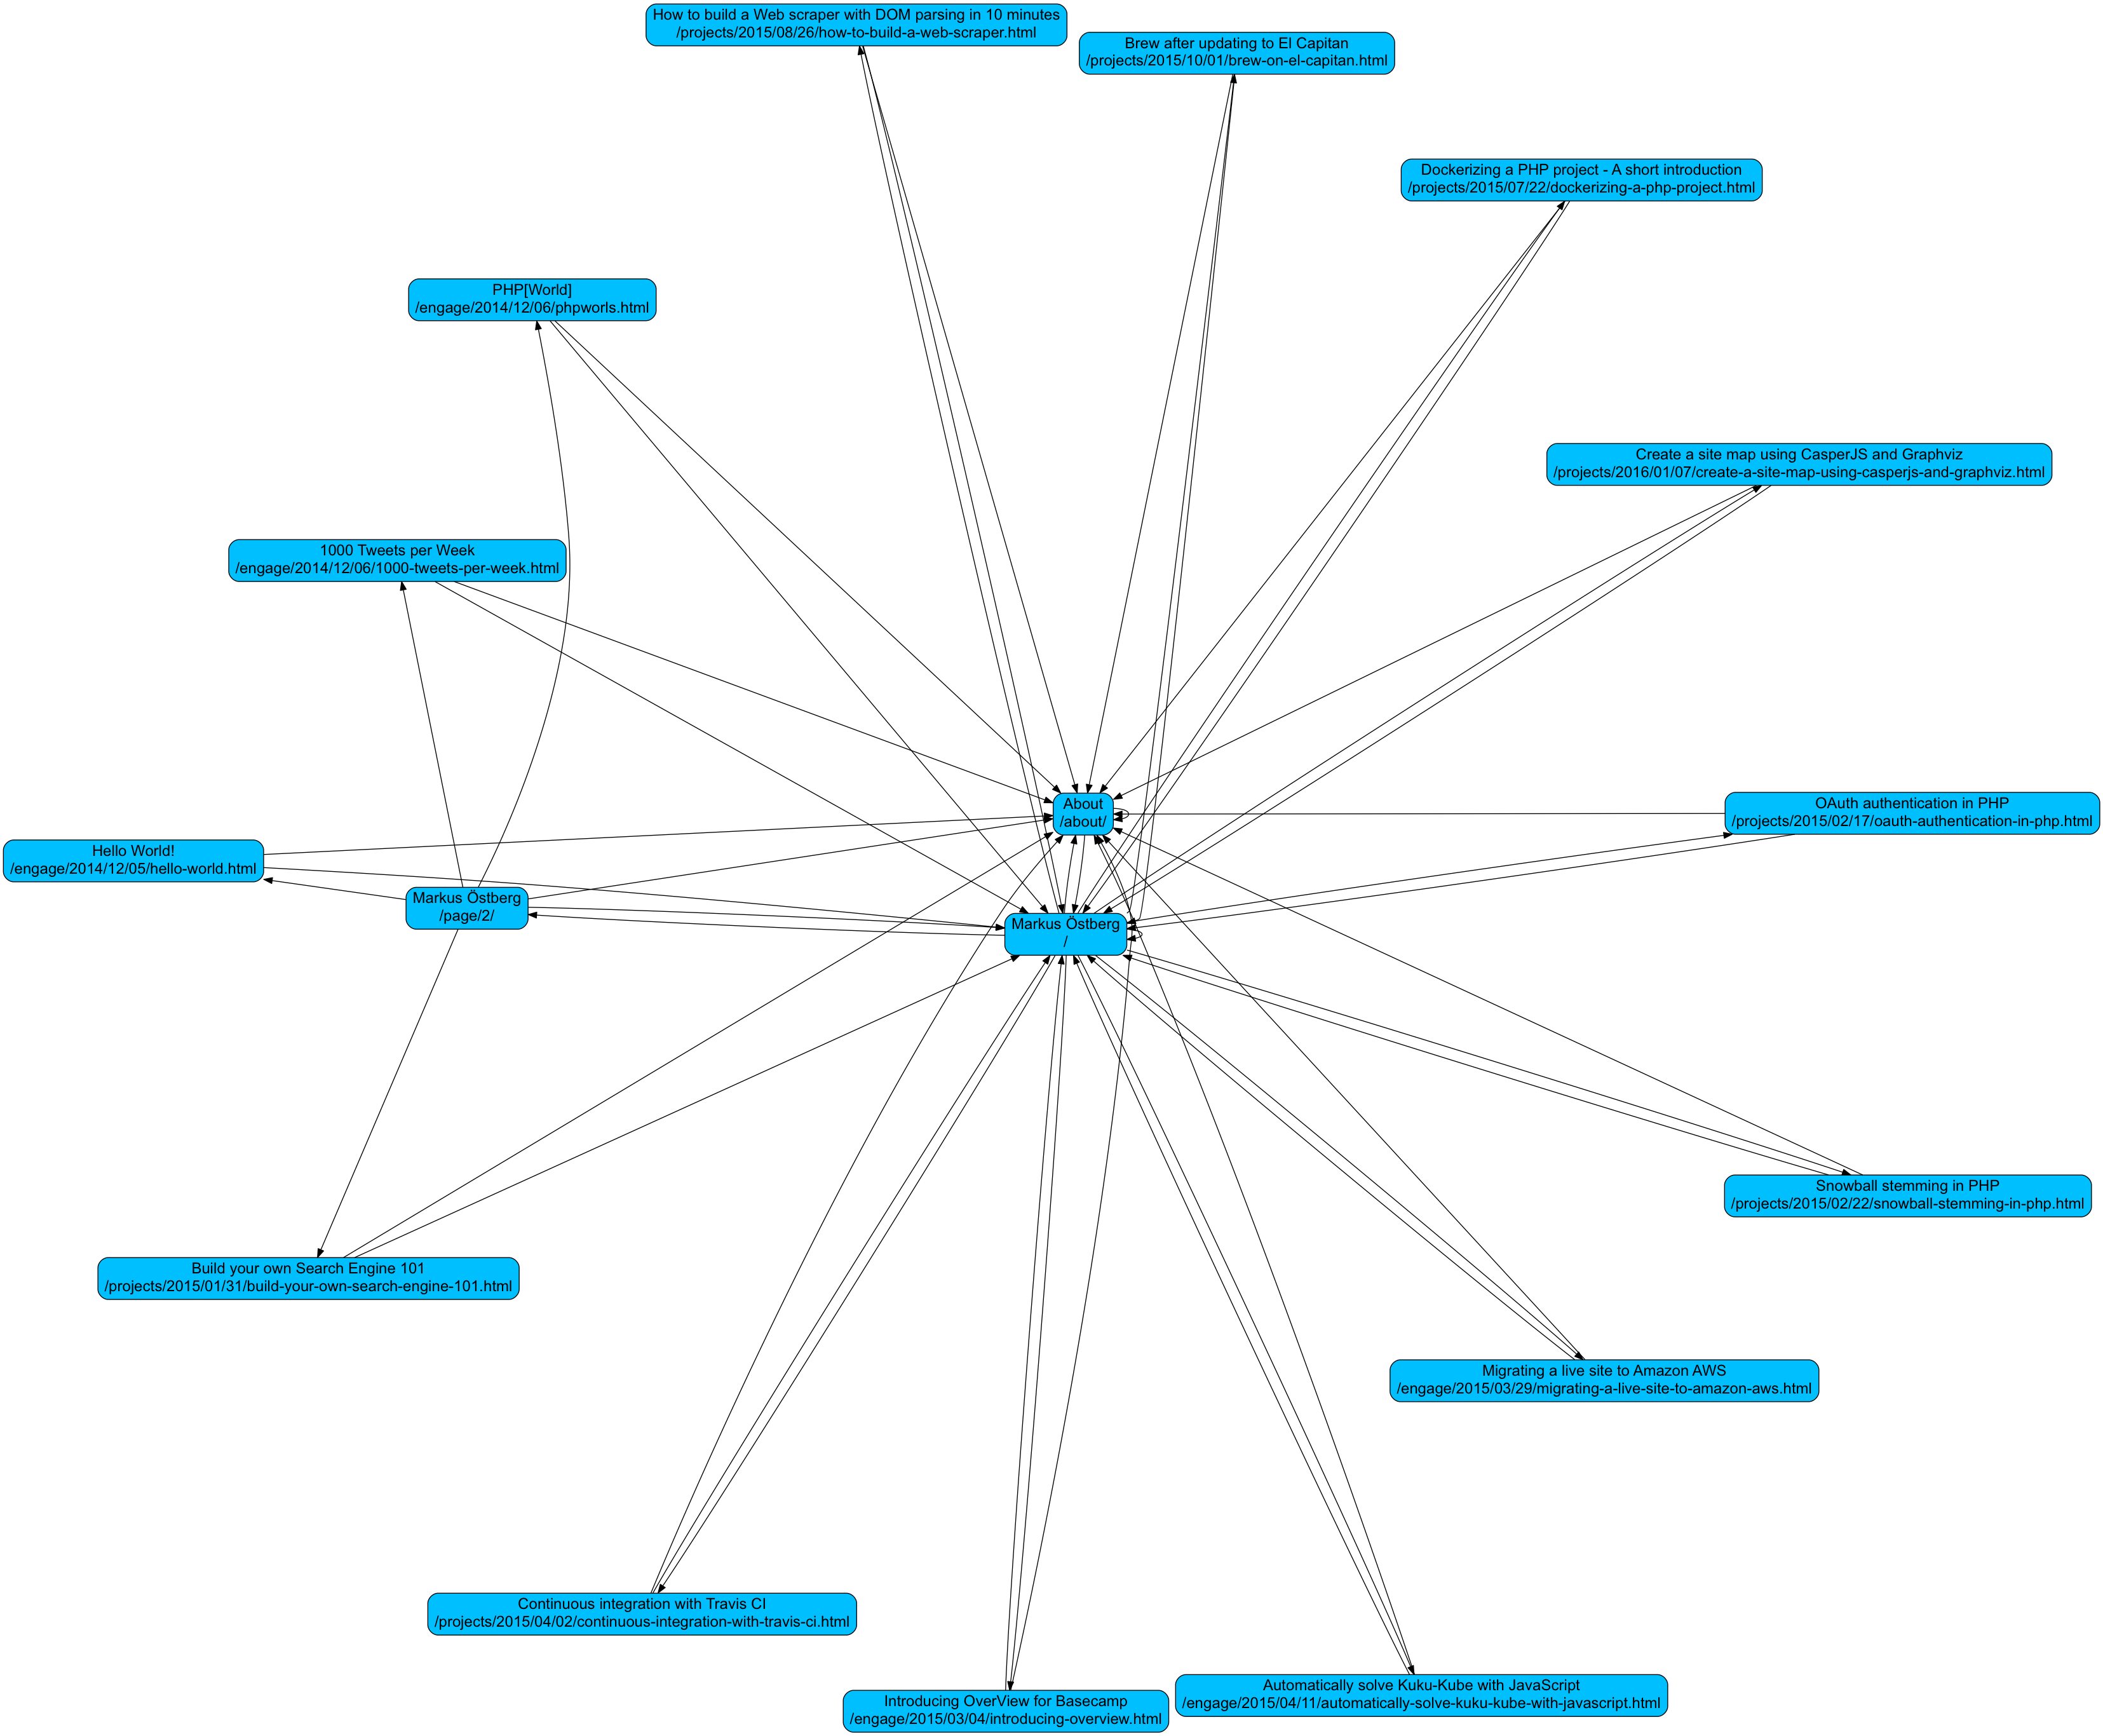
$ sfdp -Tsvg map.dot -o sitemap.svgThis creates an SVG image of the site map. It could look something like this:
Have any questions or ways to improve the script? Leave a question here below!
